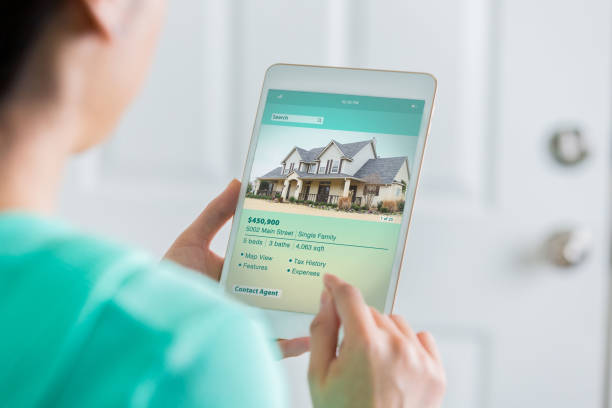
Use the local price-per-square-foot ranges to filter faster
You're trying to decide which homes are worth your time to tour and which ones will be a pricing headache. My answer use the recent price-per-square-foot distribution as your first filter, then verify condition and layout on the shortlist of properties.
If you only remember one closed data point right now, make it this in the past three months, sold homes clustered heavily between $500 and $800 per square foot. The count by range was 10 homes at $500-$600 per square foot, 12 homes at $600-$700 per square foot, and 13 homes at $700-$800 per square foot. This changes your plan because it gives you a fast way to spot outliers before you burn weekends touring. A home priced far outside the bands where most sales occurred may still be justified, but it needs a clear reason in layout, condition, or features. Some metrics were not reported for this period. Start your touring list by putting every candidate home into a price-per-square-foot bucket and flag the outliers for a tougher review. Ask for the details that support the number what is the usable living area, and does the layout match how you will actually live in it. When you see a home priced in the same bands where most recent sales occurred, move quickly to confirm the big-ticket items and write with confidence because your pricing reference is grounded in what has been closing in Bayside, NY.

About Anthony Robinson
Anthony Robinson is a licensed Real Estate Professional affiliated with RE/MAX Team, specializing in the Bayside market. With a focus on strategic marketing and deep local knowledge, Anthony Robinson provides clients with expert guidance in navigating complex real estate transactions. View full profile →