February 2026: Temple City, CA Market by the Numbers
Crunching the numbers always sheds light on market behavior in Temple City, CA. In February 2026, both buyers and sellers are relying more than ever on data to make strong decisions. Plenty of new listings are active, and price movements reveal a fast paced environment in every segment.
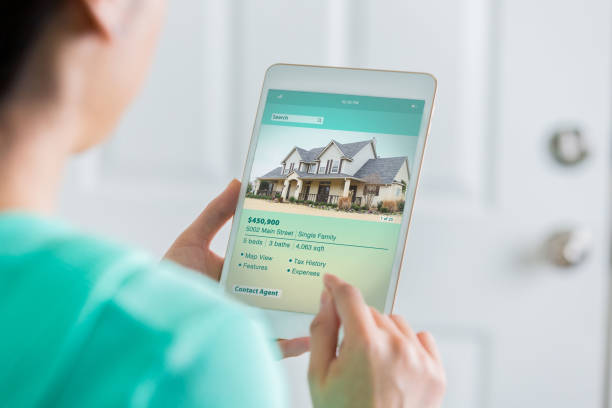
There are ten active homes for sale, ranging from $968,888 up to $1,488,888, and price per square foot values between $595 and $886. These metrics clearly show why rapid offers and negotiations are prominent. Check detailed numbers on Temple City, CA sales for more up to the moment facts.
Key Market Metrics for February 2026
- Active listings: 10 homes for sale
- Active price range: $968,888 to $1,488,888
- Price per square foot for active listings: $595 to $886
- Pending homes often move in 6 to 14 days
- List to sold price differences reach up to 11.52 percent
- Rental pricing: $2,600 to $5,880 per month
Why Market Statistics Matter in February 2026
Accurate numbers help buyers act faster and give sellers leverage. With list to sold price percentages as high as 11.52 percent, the market rewards proactive sellers and buyers ready to move quickly. Condos and townhomes also show active movement around $599,000 and price per square foot starting near $606. These facts matter because every small shift can change how quickly properties close.
Your Next Address Starts Here
Get a clear plan from Ashley Kay based on real activity in Temple City, CA this February 2026. Every number counts when making real estate decisions.
Insights That Guide Success
Tracking Trends Into March
Keeping track of numbers—like days on market, price per square foot, and active inventory—makes a difference in buying or selling outcomes. Ashley Kay translates these figures into actionable advice so each move in 2026’s market is well informed and on target. Use this month’s report for your next step in Temple City, CA.