Temple City, CA Market Summary: February 2026’s Leading Indicators
Today’s Temple City, CA real estate scene paints a vivid picture as we approach the later weeks of February 2026. From new inventory to price shifts, several metrics are pointing the way for buyers and sellers to succeed this month. Are you tracking the leading indicators that shape success in Temple City, CA for February?
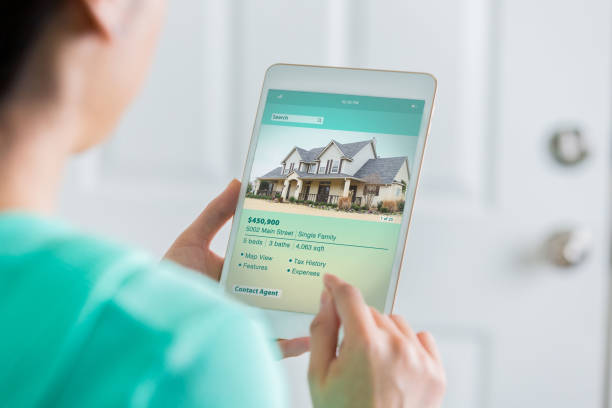
Active listings remain robust, with ten single family homes and a range of condos keeping the choices diverse. Prices from $968,888 up to $1,488,888 reflect the city’s strong market demand. Affordable homes in Temple City, CA this February 2026 go fast, with average days on market staying under fourteen and list to sold prices sometimes exceeding asking by more than ten percent.
Key Data Trends for February 2026
- Ten active listings, $968,888–$1,488,888
- Pending sales in just 6–14 days
- Rental pricing: $2,600–$5,880 per month
- High demand keeps list to sold price difference strong
- Condos often close quickly and efficiently
Who Benefits From This Month’s Trends?
Buyers willing to make decisions fast are reaping the rewards of freshly listed homes, while sellers enjoy quick closings and premium final sale prices. Condos and townhomes remain popular, with price per square foot as high as $886 on new stock and up to $827 on closed deals. Temple City, CA market insights for sellers.
Tour Smarter, Offer Stronger
Ashley Kay keeps clients current with real time numbers and proven strategies for Temple City, CA. February 2026 offers leading indicators and action plans unique to this market.
Getting the Most Out of February 2026
Plan, Act, and Win With Data
Every metric points to an active, opportunity rich market for Temple City, CA this February 2026. Talk to Ashley Kay to see which approach matches your goals and the month’s leading real estate indicators.